Data Sheet: Software
Highlights of Illumina Beadstudio Software
• Cutting Edge:
powerful data manipulation, heat map and cluster analysis
• See Your Data in a New Way:
graphical analysis using the Illumina Genome Viewer (IGV) and
Illumina Chromosome Browser (ICB)
• High Performance:
sophisticated algorithms to support of genomic investigation
• Integrative:
common framework that supports multiple application
modules
• Freedom for Downstream Analysis:
export data for use in downstream applications (e.g.,
SpotFire
®
or GeneSpring
®
)
Introduction
As high-throughput systems enable increasingly complex bioinfor-
matics data to be generated, researchers turn towards managing,
processing, and analyzing their data. Thus, there is a need for a state-
of-the-art software package that combines ease-of-use with powerful
visualization tools to streamline the analysis process. Illumina is proud
to introduce its leading-edge analytical software platform, BeadStudio,
and its associated analytical modules (GT, GX, LOH Plus).
BeadStudio’s modular design allows Illumina to respond to evolving
customer needs by releasing add-on software modules that integrate
seamlessly into the BeadStudio Framework.
As new assays or applications are developed, the BeadStudio product
family will continue to support scientists’ most current needs. This
modular approach also enables users to rely on a familiar common
graphical user interface, minimizing the need for new software training
as additional modules are released. In addition, the BeadStudio archi-
tecture is designed to support the ow of information for downstream
data compatibility with other applications (e.g., SpotFire or Gene-
Spring).
Illumina
®
BeadStudio Data Analysis Software
Modules
Illumina’s BeadStudio delivers high-quality software for cutting-edge data analysis and advanced
visualization tools for the following applications: Genotyping, Gene Expression, and Loss of
Heterozygosity (LOH).
Genotyping (GT) Module
The BeadStudio GT Module provides automated genotype calling
and sample clustering. Powerful visualization tools and quality-control
features enable graphical output of data and reports on reproducibility
and Mendelian consistency. Bead Studio Framework features such
as heat maps, scatter plots, the Illumina Genome Viewer (IGV), the
Illumina Chromosome Browser (ICB), the Illumina Sequence Viewer
(ISV) and Innium Laboratory Information Management System (LIMS)
integration add additional functionality to this module.
Gene Expression (GX) Module
The BeadStudio GX Module is designed for analysis of Whole-
Genome Gene Expression BeadChips and Focused Arrays for the
Direct Hyb and DASL
®
Assays. Advanced analytical features include
gene-level analysis, statistical tools for differential expression analysis,
sample controls, heat maps (Figure 3), bar plots and clustering tools.
Enhanced data management enables hierarchical organization of
samples, groups, groupsets and associated project analysis.
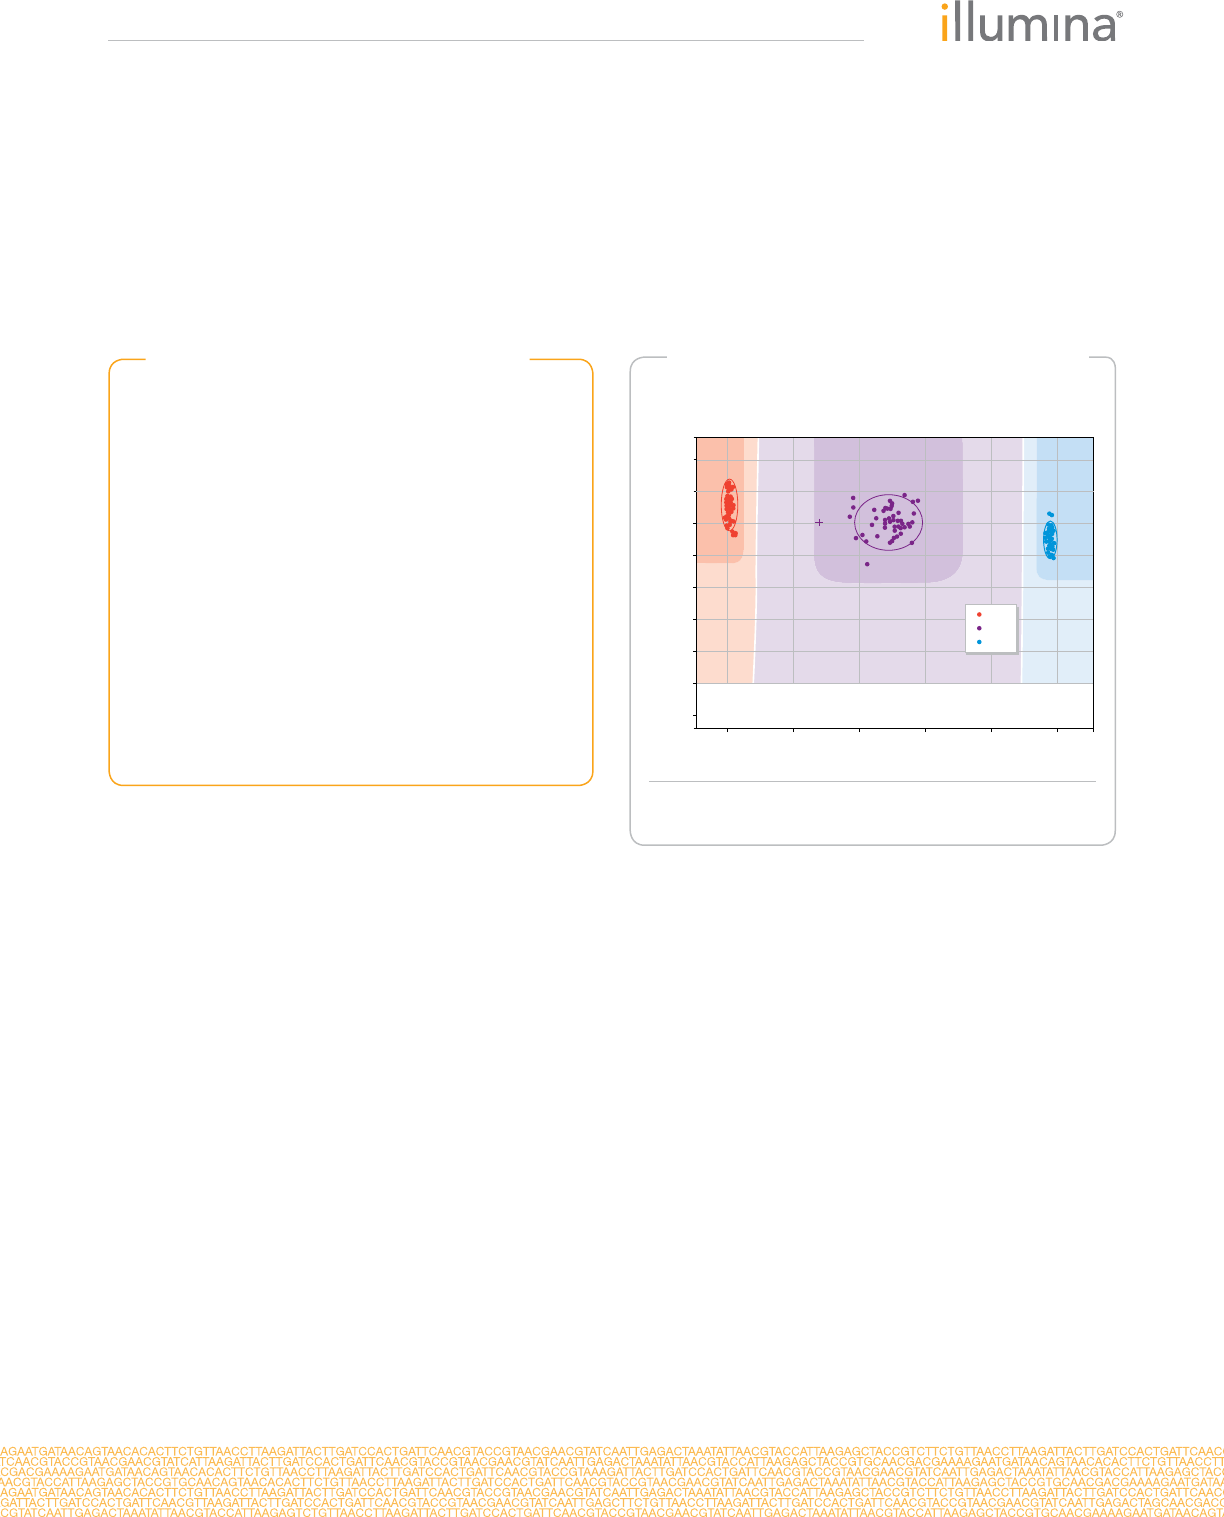
Figure 1: Genoplot Generated Using Beadstudio
Genotyping Module
0.50
0.70
0.60
0.40
0.20
-0.10
0.30
0.10
0.00
Normalized R
0 0.20 0.40 0.800.60 1
Normalized Theta
rs872381
21 45 29
AA
AB
BB
The BeadStudio Genotyping Module clusters genotype calls into AA, AB
and BB clusters for easy viewing and data analysis.

Data Sheet: Software
Loss of Heterozygosity Plus (LOH Plus) Module
The BeadStudio LOH Plus Module is designed to address chro-
mosomal aberrations and allelic imbalance in paired samples (e.g.,
matched normal/tumor pair). Key features of this module include: au-
tomated detection of chromosomal aberrations, custom bookmarking
of genomic regions of interest and a chromosomal heat map to reect
LOH/Copy Number-related intensity differences along chromosomes.
The Bookmarked Samples Report also allows the user to create a
summary of various aberrations.
Beadstudio Framework Features
The BeadStudio Framework is the basis of BeadStudio and includes
many customizable features and formats for powerful data analysis.
Project Wizard
The BeadStudio Project Wizard helps the user initiate and organize
projects with ease. Using the Project Wizard simplies decision-mak-
ing so less time is required for setup, allowing more time for analysis.
Illumina Genome Viewer (IGV)
The IGV allows visualization of sample-related data on a genome-wide
scale or at the chromosomal level. The IGV can display up to four
plots at a time (a single data series each) over a chosen chromosome
(Figure 2).
Illumina Chromosome Browser (ICB)
Using the ICB, the user can browse imported SNPs within the context
of a chromosome (e.g., SNPs relative to exons). Both the IGV and ICB
offer a wide range of visualization options for data analysis.
Data Tables
Advanced data table features allow the user to customize data viewing
for efcient and effective data analysis. Options include:
• importing columns
• adding derived columns
• sorting
• selecting and marking rows
• advanced data ltering
• exporting data
Reports
Custom or standard reports can be created for various types of analy-
sis. Implementing consistent report formats can streamline analysis
and discovery.
Figure 2: LOH Plus Module
log (subject sample
/reference sample)
intensities
heterozygote
allele frequency
difference between
paired samples
subject sample
allele frequency
reference sample
allele frequency
2
The Illumina Genome Viewer enables classic LOH analysis by comparing
reference and subject sample data from the same donor.
Table 1: Beadstudio Tools
Feature Highlight
BeadStudio Project Wizard Easy project set-up and organization
Illumina Genome Viewer View data patterns across the genome
Illumina Chromosome Browser Browse data at the chromosome and gene level
Illumina Sequence Viewer Browse data at the sequence level
Table Filters Congure with easy-to-use, rule-based options
Import Data Import cluster les, import columns into tables
Export Data Export cluster les, export table data
Generate Reports Create standard or custom reports
Scatter Plots For graphical viewing of data
Heat Map For graphical viewing of data
LOH/Copy Number Analyze Loss of Heterozygosity/Copy Number
Auto Detection Search for chromosomal aberrations (in addition to manual curation)
Data Integration Customize reports for integration into other downstream applications

Data Sheet: Software
Graphs
BeadStudio graphic display options allow the user to plot table data in
a number of ways, including the following formats:
• Histograms
• Line Graphs
• Scatter Plots
• Heat Maps
• Cluster Plots
• Many More Module-Specic
• Capabilities
Figure 3: Gene Expression Module
The heat map dendrogram clusters rows (Target ID) and columns (Differen-
tial Scores). Using the Heat Map tools within the Gene Expression Module
allows the investigator to easily visualize and analyze large amounts of data.
Data Integration
Customizable reports and data export options simplify integration with
other downstream analytical applications.
Summary
BeadStudio is designed to be leading-edge, modular and integrative.
BeadStudio consists of individual software modules specic to vari-
ous product applications. Users can rely on the familiar BeadStudio
Framework while minimizing additional product training as they expand
their analytical capabilities from a single module to multiple modules.
BeadStudio is designed for downstream data compatibility with other
applications. This modular architecture enhances the ow of informa-
tion from data analysis to downstream scientic discovery.
Additional Information
Visit www.illumina.com or contact us at the address below to learn
more about BeadStudio or other solutions from Illumina.
Table2: Hardware and Software Requirements
Feature Highlights
CPU Speed Intel
®
Pentium
®
2.0 GHz
or above
Memory Size ≥ 2 GB
Hard Drive ≥ 100 GB
Video Display 1280 x 1024 recommended,
1024 x 768 required
Monitor Display LCD or CRT 17” recommended
Operating System Windows XP - SP2 (32bit) or
Windows XP - SP2 (64 bit)
Specic OS Requirements Requires Microsoft .NET
framework 1.1 or above
Illumina, Inc. • 9885 Towne Centre Drive, San Diego, CA 92121 USA • 1.800.809.4566 toll-free • 1.858.202.4566 tel • [email protected] • illumina.com
For research use only
© 2010 Illumina, Inc. All rights reserved.
Illumina, illuminaDx, Solexa, Making Sense Out of Life, Oligator, Sentrix, GoldenGate, GoldenGate Indexing, DASL, BeadArray,
Array of Arrays, Innium, BeadXpress, VeraCode, IntelliHyb, iSelect, CSPro, GenomeStudio, Genetic Energy, HiSeq, and HiScan are
registered trademarks or trademarks of Illumina, Inc. All other brands and names contained herein are the property of their respective
owners. Pub. No. 970-2006-007 Current as of 13 July 2006
Data Sheet: Software
Ordering Information
Catalog No. Product Description
SW-10-101
BeadStudio Genotyping (GT) Module (Single
Seat) - New License
New single-seat license for BeadStudio Geno-
typing (GT) Module provides advanced tools for
SNP data analysis.
SW-10-102
BeadStudio Genotyping (GT) Module (Five Seats)
- New License
New single-seat license for BeadStudio Geno-
typing (GT) Module provides advanced tools for
SNP data analysis.
SW-10-200
BeadStudio Genotyping (GT) Module (Single Site
w/ Warranty) - Upgrade
Single-site upgrade license for systems with
warranty coverage. BeadStudio Genotyping (GT)
Module provides advanced tools for SNP data
analysis.
SW-10-300
BeadStudio Genotyping (GT) Module (Enterprise
w/ Warranty) - Upgrade
Enterprise upgrade license for system with
warranty coverage. BeadStudio Genotyping (GT)
Module provides advanced tools for SNP data
analysis.
SW-10-400*
BeadStudio Genotyping (GT) Module (Five Seats
w/Warranty) - Upgrade
Complimentary ve-seat upgrade license for
system with warranty coverage. BeadStudio
Genotyping (GT) Module provides advanced
tools for SNP data analysis.
SW-20-101
BeadStudio Gene Expression (GX) Module (Single
Seat) - New License
New single-seat license for BeadStudio Gene
Expression (GX) Module provides advanced
tools for gene expression data analysis.
SW-20-400*
BeadStudio Gene Expression (GX) Module (Five
Seats w/Warranty) - Upgrade
Complimentary ve-seat upgrade license for sys-
tem with warranty coverage. BeadStudio Gene
Expression (GX) Module provides advanced
tools for Gene Expression data analysis.
SW-30-101
BeadStudio LOH Plus Module (Single Seat) - New
License
New single-seat license for BeadStudio Loss of
Heterozygosity Plus (LOH Plus) Module provides
advanced tools for LOH/Copy Number data
analysis.
SW-30-400*
BeadStudio LOH Plus Module (Five Seats w/War-
ranty) - Upgrade
Complimentary ve-seat upgrade license for
system with warranty coverage. BeadStudio
Loss of Heterozygosity Plus (LOH Plus) Module
provides advanced tools for LOH/Copy Number
data analysis.
*free upgrade for current customers
For a complete listing of BeadStudio Products, contact Customer Solutions at address below.
